
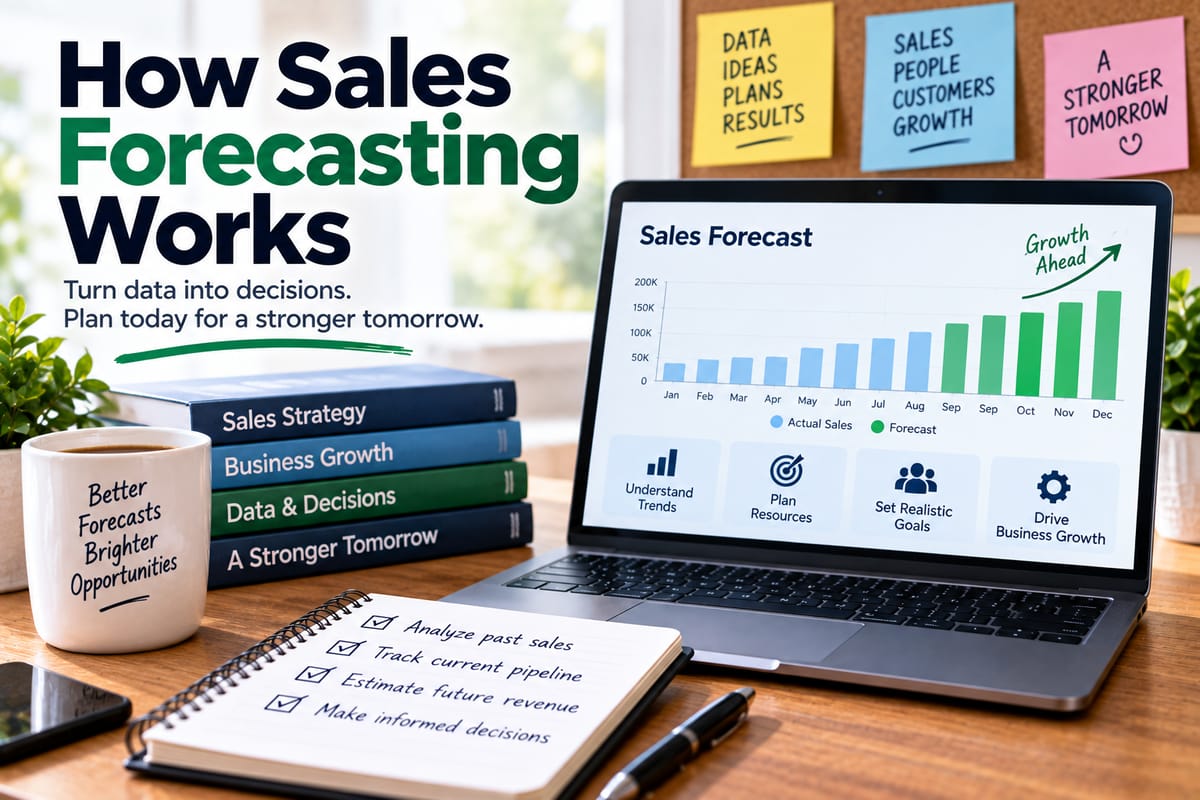
How Sales Forecasting Works
Sales forecasting is the process businesses use to estimate how much revenue they expect to generate from sales during a future period. It helps companies plan inventory, staffing, marketing, spending, cash flow, and other operational decisions based on expected customer demand.
A sales forecast is not simply a guess about how much a business will sell. A well-developed forecast combines historical sales data, current opportunities, customer behavior, market conditions, sales activity, and business assumptions to produce a structured estimate.
Forecasting can be useful for a small business with a handful of customers as well as a large company managing thousands of sales opportunities across multiple markets.
The quality of a forecast depends heavily on the quality of the information used to create it and how consistently the business updates its assumptions.
What Is Sales Forecasting?
Sales forecasting is the process of estimating future sales for a specific period.
A forecast might cover:
- The next week
- The next month
- The next quarter
- The next six months
- The next year
- Multiple years for long-term planning
Businesses can forecast sales in terms of:
- Revenue
- Number of units sold
- Number of customers
- New contracts
- Sales by product
- Sales by region
- Sales by salesperson
- Sales by customer segment
For example, a company might forecast $500,000 in sales for the next quarter.
It could then break that number down by product, sales team, geographic market, or individual opportunity.
The purpose is to create a realistic picture of what the business may sell so that management can make better-informed plans.
Why Sales Forecasting Matters
Sales revenue influences many other parts of a business.
When a company expects strong sales, it may need to:
- Increase inventory
- Hire additional employees
- Expand production
- Increase customer support capacity
- Increase marketing activity
- Prepare additional working capital
When expected sales decline, management may need to reconsider spending, inventory purchases, hiring plans, or other commitments.
Sales forecasting therefore connects the sales function with broader business planning.
It can help answer questions such as:
- How much revenue might we generate?
- How much inventory should we prepare?
- Can we afford planned expenses?
- How many employees might we need?
- Are we on track to meet our sales target?
- Which products are expected to contribute the most revenue?
- Where are potential shortfalls developing?
Sales Forecasting Is Not the Same as Setting a Sales Target
A sales target is a goal.
A sales forecast is an estimate of what is likely to happen based on available information.
For example, a company might set a quarterly sales target of $1 million.
Its current forecast might be $850,000.
The target represents the desired result, while the forecast represents the team’s current estimate.
Confusing these two concepts can make forecasting less useful.
A forecast should generally reflect the evidence available, even when that evidence suggests the business may fall short of its target.
How Sales Forecasting Works
The basic forecasting process can be summarized as:
Collect data → Analyze sales activity → Estimate opportunities → Apply assumptions → Calculate expected sales → Review the forecast → Compare results with actual sales
The process is usually repeated regularly.
As new sales opportunities appear, existing opportunities progress or disappear, customer demand changes, and actual sales are recorded, the forecast can be updated.
This makes forecasting an ongoing business activity rather than a one-time calculation.
Start With Historical Sales Data
Historical sales data is often one of the first inputs businesses use when developing a forecast.
Past information can reveal patterns involving:
- Monthly revenue
- Quarterly revenue
- Product sales
- Customer purchases
- Seasonal demand
- Sales growth
- Average order values
- Customer retention
- Conversion rates
For example, a retailer might discover that sales consistently increase during certain months.
A software company might notice that its sales cycle typically becomes longer toward the end of a financial year.
Historical information does not guarantee that the same pattern will repeat, but it provides a useful foundation for forecasting.
Analyze Current Sales Opportunities
Past sales are only part of the picture.
Businesses also need to examine opportunities currently being pursued by their sales teams.
This may include:
- New leads
- Qualified prospects
- Product demonstrations
- Proposals
- Negotiations
- Contracts awaiting signature
- Renewals
- Expansion opportunities
A sales opportunity that is close to closing may have a different forecast value from a newly identified lead.
Understanding where each opportunity sits in the buying process is therefore important.
The What Is a Sales Pipeline and How Does It Work? guide provides broader context on how businesses organize and manage these opportunities.
The Role of the Sales Pipeline
A sales pipeline provides a structured view of potential customers as they move through different stages of the sales process.
A simplified pipeline might look like:
Lead → Qualified Prospect → Discovery → Proposal → Negotiation → Closed Sale
Each stage provides information about the likelihood that an opportunity will eventually become revenue.
For example, a newly qualified prospect may be less certain than a customer that has approved a proposal and is preparing to sign a contract.
Forecasting systems can use this stage information to estimate how much of the pipeline may eventually convert into actual sales.
Probability-Weighted Forecasting
One common forecasting approach is to assign a probability to each sales opportunity.
Suppose a salesperson has three opportunities:
| Opportunity | Potential Value | Estimated Probability | Weighted Value |
|---|---|---|---|
| A | $100,000 | 80% | $80,000 |
| B | $60,000 | 50% | $30,000 |
| C | $40,000 | 25% | $10,000 |
The probability-weighted forecast would be:
$80,000 + $30,000 + $10,000 = $120,000
This does not mean the company will necessarily generate exactly $120,000.
Instead, it provides an estimate based on the assumed probabilities.
The usefulness of this method depends heavily on whether the assigned probabilities reasonably reflect actual conversion rates.
Forecasting by Sales Stage
Another approach is to estimate future revenue based on the stage of each opportunity.
For example:
| Sales Stage | Estimated Close Rate |
|---|---|
| Qualified | 20% |
| Proposal | 50% |
| Negotiation | 75% |
| Contract Review | 90% |
If a company has $200,000 in opportunities at the proposal stage, it might assign an estimated $100,000 of forecast value based on a 50% historical close rate.
This approach works best when the business has enough historical information to understand how opportunities at each stage tend to perform.
Forecasting Based on Historical Trends
Some businesses use historical growth rates to estimate future sales.
Suppose a company generated:
- $400,000 in sales last quarter
- $440,000 this quarter
That represents 10% growth.
If management believes similar conditions will continue, it could use that trend as one input for the next forecast.
However, simply applying historical growth indefinitely can produce unrealistic results.
Growth rates can change because of:
- Competition
- Pricing changes
- Market saturation
- Economic conditions
- Product changes
- Customer behavior
- Business strategy
Historical trends should therefore be treated as evidence rather than certainty.
Forecasting by Product
Businesses with multiple products may forecast each product separately.
For example:
| Product | Expected Units | Average Price | Forecast Revenue |
|---|---|---|---|
| Product A | 1,000 | $50 | $50,000 |
| Product B | 600 | $100 | $60,000 |
| Product C | 200 | $250 | $50,000 |
The total expected revenue would be $160,000.
This approach can reveal which products are expected to drive future revenue and which may be experiencing declining demand.
Forecasting by Customer Segment
Sales can also be forecast according to customer type.
A company might divide customers into:
- Small businesses
- Mid-sized businesses
- Large enterprises
- Government organizations
- Individual consumers
Each group may have different purchasing patterns, sales cycles, average order values, and retention rates.
Separating the segments can make the forecast more informative than treating every customer as identical.
Forecasting by Sales Representative
Sales managers may also forecast performance at the individual salesperson level.
For example:
| Salesperson | Pipeline | Forecast |
|---|---|---|
| Salesperson A | $500,000 | $300,000 |
| Salesperson B | $400,000 | $250,000 |
| Salesperson C | $300,000 | $180,000 |
This can help managers understand whether the overall sales forecast is supported by sufficient activity across the sales team.
It can also identify situations where one salesperson has an unusually large or small contribution to the projected result.
The Importance of the Sales Cycle
The amount of time required to convert a prospect into a customer can have a major effect on forecasting.
A business with a short sales cycle may be able to forecast relatively close to the actual sales period.
A business with a six-month or twelve-month sales cycle may need to track opportunities much earlier.
For example, an enterprise software company might spend months negotiating a major contract.
A consumer business may complete a sale within minutes.
The same forecasting method may therefore not work equally well for both businesses.
How Sales Processes Affect Forecast Accuracy
Forecasting becomes easier when the sales process is clearly defined.
A company needs to understand what each stage means and what typically happens before an opportunity moves forward.
The How Business Sales Processes Convert Leads Into Paying Customers guide explores how businesses move prospects through the sales process toward completed purchases.
When stages are consistently defined, management can compare current opportunities with historical performance.
For example, if proposals historically convert into sales 60% of the time, that information can inform the forecast.
If sales representatives use different definitions for “proposal,” however, the resulting data may be less reliable.
Bottom-Up Sales Forecasting
A bottom-up forecast begins with individual sales opportunities, customers, products, or sales representatives.
The business adds these estimates together to create an overall forecast.
For example:
Salesperson A: $200,000
Salesperson B: $175,000
Salesperson C: $225,000
Total forecast: $600,000
The advantage is that the forecast can be closely connected to actual sales activity.
The disadvantage is that individual estimates can sometimes be overly optimistic or inconsistent.
Top-Down Sales Forecasting
A top-down forecast starts with a broader business estimate.
Management might examine:
- Market size
- Historical growth
- Industry trends
- Company growth rates
- Customer demand
- Strategic plans
The company could then estimate total sales and allocate that amount across products, regions, or teams.
Top-down and bottom-up approaches can also be compared.
If the two forecasts differ significantly, management may investigate why.
Qualitative Sales Forecasting
Not every forecast relies entirely on mathematical calculations.
Sales managers and experienced salespeople may provide judgments based on what they know about customers and opportunities.
This can be useful when:
- Historical data is limited
- A company is launching a new product
- Market conditions have changed
- A major customer is considering a purchase
- The business is entering a new market
However, subjective judgment can introduce bias.
A salesperson may feel confident about an opportunity even when historical evidence suggests that similar opportunities frequently fail to close.
For this reason, qualitative judgment is often more useful when combined with measurable evidence.
Quantitative Sales Forecasting
Quantitative forecasting uses numerical data and statistical techniques to estimate future sales.
Depending on the business, these methods can include:
- Historical averages
- Growth-rate analysis
- Moving averages
- Trend analysis
- Conversion-rate models
- Probability-weighted pipelines
- Statistical forecasting
- Predictive analytics
More advanced organizations may use software to analyze large amounts of historical and current data.
The complexity of the method should match the quality and quantity of available information.
A complicated model does not automatically produce a better forecast if its underlying data is poor.
Seasonality and Sales Forecasting
Many businesses experience seasonal changes in demand.
For example:
- Retail sales may increase during holiday periods.
- Travel businesses may have peak seasons.
- Restaurants may experience different demand patterns throughout the year.
- Education-related businesses may follow academic calendars.
- Outdoor businesses may depend on weather and seasons.
A forecast that ignores predictable seasonality can be misleading.
Historical sales data can help businesses identify recurring patterns and incorporate them into future estimates.
Pricing Changes Can Affect Forecasts
A sales forecast should account for changes in pricing where relevant.
Suppose a company sells 10,000 units at $20 each.
Its revenue would be:
10,000 × $20 = $200,000
If the price increases to $22 but unit sales decline to 9,000, expected revenue becomes:
9,000 × $22 = $198,000
The company sells fewer units but generates a similar amount of revenue.
This illustrates why businesses should forecast both sales volume and revenue when appropriate.
New Products Make Forecasting More Difficult
Forecasting a new product can be challenging because historical sales data does not exist for that specific product.
Businesses may instead examine:
- Comparable products
- Customer research
- Existing customer demand
- Market size
- Trial purchases
- Preorders
- Competitor categories
- Early sales performance
Initial forecasts may therefore contain greater uncertainty.
As real sales data accumulates, the company can gradually replace assumptions with actual performance information.
Forecasting and Business Goals
Sales forecasts are closely connected to business planning.
Management may use forecasts to determine whether current sales activity is sufficient to reach broader objectives.
For example, a business might have an annual revenue goal of $5 million.
If the latest forecast indicates $4.2 million, management can investigate the gap.
Possible responses could include:
- Increasing sales activity
- Improving conversion rates
- Expanding marketing
- Introducing new products
- Adjusting pricing
- Targeting additional customer segments
- Improving customer retention
The forecast does not determine which action the business should take. Instead, it provides information about the expected outcome under current assumptions.
Businesses can also benefit from understanding the broader relationship between objectives and measurement through How Businesses Set Goals and Measure Performance.
Forecast Accuracy Matters
After a forecast period ends, businesses can compare the forecast with actual sales.
Suppose:
Forecast: $750,000
Actual sales: $700,000
The business can investigate the difference.
Perhaps several deals were delayed.
Maybe customer demand was lower than expected.
A major customer may have canceled an order.
Alternatively, sales might have exceeded expectations.
Comparing forecasts with actual results creates an opportunity to improve future forecasts.
Measuring Forecast Variance
Forecast variance is the difference between expected and actual performance.
A simple calculation is:
Forecast variance = Actual sales − Forecast sales
If the forecast was $500,000 and actual sales were $550,000:
$550,000 − $500,000 = +$50,000
The business exceeded the forecast by $50,000.
If actual sales were $450,000:
$450,000 − $500,000 = -$50,000
The business fell $50,000 below the forecast.
The important point is not simply whether the number is positive or negative. Management should understand why the variance occurred.
Common Reasons Sales Forecasts Go Wrong
Forecasts can be inaccurate for many reasons.
Overly Optimistic Estimates
Salespeople may assume that promising opportunities will close even when there is limited evidence.
Poor Pipeline Data
If opportunities are not updated correctly, the forecast may include deals that are no longer realistic.
Inconsistent Sales Stages
If different salespeople interpret pipeline stages differently, probability estimates can become unreliable.
Unexpected Customer Behavior
Customers may delay purchases, reduce budgets, or cancel planned projects.
Market Changes
Competition, economic conditions, regulations, technology, and other external factors can change demand.
Incomplete Historical Data
New businesses may not have enough information to identify reliable patterns.
Long Sales Cycles
A deal expected to close this quarter may be delayed into the next one.
How Businesses Can Improve Forecast Accuracy
Forecast accuracy can improve when companies establish disciplined processes.
Useful practices include:
- Updating opportunities regularly
- Defining sales stages clearly
- Recording realistic close dates
- Reviewing pipeline quality
- Comparing forecasts with actual results
- Tracking conversion rates
- Separating likely deals from speculative opportunities
- Using historical performance
- Documenting assumptions
- Training sales teams on forecasting expectations
Consistency is particularly important.
A sophisticated forecasting model cannot compensate for sales information that is outdated or incomplete.
The Role of Technology in Sales Forecasting
Modern sales teams often use customer relationship management systems and analytics platforms to organize forecasting information.
These systems can track:
- Customer records
- Sales opportunities
- Deal values
- Sales stages
- Expected close dates
- Sales activity
- Historical conversions
- Revenue forecasts
Automated dashboards can then aggregate information across the sales organization.
Some businesses also use advanced analytics and machine-learning tools to identify patterns in historical sales data.
Technology can make forecasting faster and more scalable, but human judgment remains important when unusual circumstances arise.
Forecasting Cash Flow and Resource Requirements
Sales forecasts can influence more than sales targets.
Expected revenue can affect:
- Hiring decisions
- Inventory purchases
- Production schedules
- Cash planning
- Marketing budgets
- Customer support staffing
- Equipment purchases
- Expansion decisions
For example, if a business expects sales to double over the next year, it may need significantly more capacity to fulfill orders.
The sales forecast can therefore become an input into broader operational planning.
Forecasting for Different Business Sizes
A small business may use a simple spreadsheet to track expected sales.
A larger company may use specialized forecasting software connected to its CRM, accounting system, inventory platform, and analytics tools.
The underlying principles remain similar:
Understand past performance → assess current opportunities → estimate future demand → compare expectations with actual results → improve the forecast
The difference is primarily in the scale and complexity of the data.
A Simple Example of Sales Forecasting
Imagine a small consulting company has five active sales opportunities.
| Opportunity | Value | Probability |
|---|---|---|
| Client A | $20,000 | 90% |
| Client B | $15,000 | 70% |
| Client C | $30,000 | 50% |
| Client D | $10,000 | 30% |
| Client E | $25,000 | 20% |
The probability-weighted forecast would be:
- Client A: $18,000
- Client B: $10,500
- Client C: $15,000
- Client D: $3,000
- Client E: $5,000
Total:
$51,500
The company’s total pipeline is $100,000, but the probability-weighted forecast is $51,500.
This illustrates why pipeline size and forecasted revenue are not necessarily the same thing.
Forecasting Should Be Updated Regularly
A forecast becomes less useful when it is allowed to become outdated.
Sales opportunities change constantly.
A customer might:
- Increase an order
- Reduce an order
- Delay a decision
- Cancel a project
- Sign earlier than expected
- Request additional products
New opportunities can also enter the pipeline.
Regular updates allow the forecast to reflect the latest available information.
Some companies update forecasts weekly, while others use different schedules based on their sales cycles.
The Difference Between Pipeline and Forecast
A sales pipeline shows potential business opportunities.
A sales forecast estimates which portion of those opportunities is likely to become actual sales during a defined period.
For example:
Total pipeline: $2 million
That does not necessarily mean the company expects $2 million in revenue.
If many opportunities are at early stages, the forecast may be substantially lower.
This distinction is essential for interpreting sales reports correctly.
Forecasting as a Continuous Learning Process
The most useful forecasting systems improve over time.
After each reporting period, businesses can examine:
- What was forecast?
- What actually happened?
- Which opportunities closed?
- Which opportunities were delayed?
- Which opportunities disappeared?
- Which sales stages converted reliably?
- Which assumptions were incorrect?
Over multiple periods, this information can reveal patterns.
For example, a company might discover that deals labeled as “90% likely” actually close only 70% of the time.
That information can be used to improve future forecasting assumptions.
Building a More Reliable Sales Forecast
An effective sales forecast does not need to predict the future perfectly.
Its purpose is to provide a useful estimate that helps management make informed plans.
A strong forecasting process combines:
- Historical sales data
- Current pipeline information
- Realistic probability estimates
- Clear sales-stage definitions
- Knowledge of sales cycles
- Seasonal considerations
- Market and customer information
- Regular forecast updates
- Comparison with actual results
- Continuous improvement
The result is a forecast that becomes increasingly useful as the business learns from its own performance.
Turning Sales Data Into Better Business Planning
Sales forecasting connects what a business knows today with the decisions it needs to make about tomorrow.
Historical sales reveal patterns. Current pipeline activity provides information about potential future revenue. Probability estimates help distinguish stronger opportunities from uncertain ones, while regular comparisons between forecasts and actual results show where assumptions need improvement.
The most useful forecast is not necessarily the one with the most complicated formula. It is the one built from reliable information, realistic assumptions, consistent processes, and regular review.
When sales teams and business leaders treat forecasting as an ongoing process rather than a once-a-quarter exercise, the resulting information can become a practical foundation for planning revenue, staffing, inventory, spending, and growth.




2 Comments
Micle harison
June 7, 2019Lorem ipsum dolor sit amet, usu ut perfecto postulant deterruisset, libris causae volutpat at est, ius id modus laoreet urbanitas. Mel ei delenit dolores.
John Doe
June 7, 2019Some consultants are employed indirectly by the client via a consultancy staffing company.